Why monitoring belongs in the hosting panel#
Most Windows hosting servers end up with monitoring bolted on: Performance Monitor counters nobody reads, an external ping check that only notices when the whole box is down, and an RDP session to Task Manager when a customer complains. None of that knows which subscription a w3wp.exe belongs to, or whether the MailEnable queue is backing up.
StackRegent builds monitoring into the panel that already knows your accounts. It measures the server, IIS, mail and databases every minute, ties usage to subscriptions and websites, and sends alerts through the mail setup you already have. When something goes wrong, the tools to fix it are a click away: services, processes, tasks, logs and repair checks.
The Home dashboard#
Home opens with CPU, memory, the main disk and the number of running services. If a service set to start automatically is not running, a warning links straight to Services Management.
Below are widgets you can hide or reorder with Customize: Advisor, SSL/TLS certificates expiring within 30 days, Subscriptions with overuse, a 24-hour CPU and memory chart, Server information, the StackRegent version with Check for updates, Disks, Recent tasks, Last server backup and What's new. It is the page to glance at each morning.
Windows server monitoring in a hosting panel: graphs every minute#
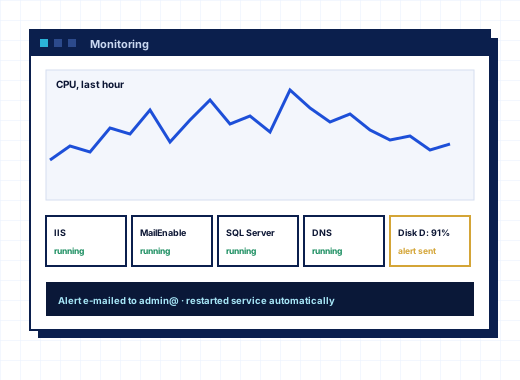
Server Management › Monitoring collects figures every minute and draws them for any range from 1 hour to 1 year.
The Server tab covers:
- CPU and memory,
- disk activity and disk space per drive,
- network traffic,
- IIS requests and current connections,
- messages waiting in the mail queue,
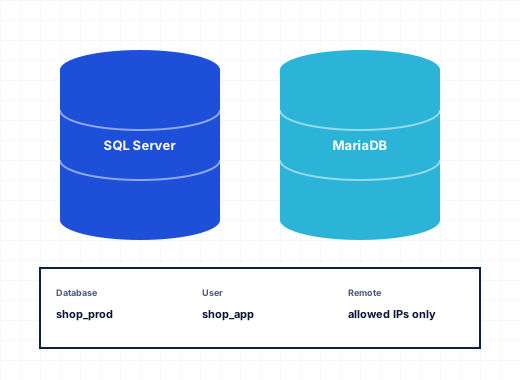
- MariaDB and SQL Server connections.
The Websites tab narrows it down: choose a subscription to see its application pool's CPU and memory and each website's requests and traffic. When the server graph shows a spike, this is where you find which site caused it.
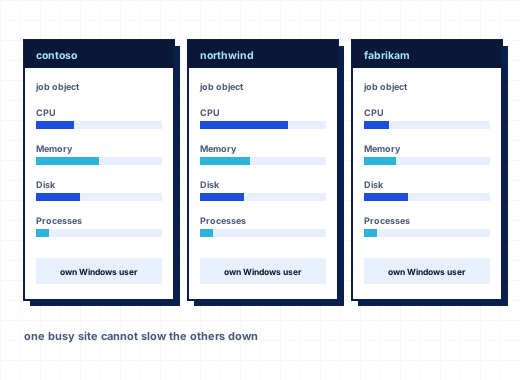
For per-account limits, the Resource Usage pages show each subscription's CPU, memory, disk I/O and processes against its limits, with a Limit reached count for the last 24 hours. See resource limits and isolation.
Email alerts with thresholds and durations#
The Alerts tab turns graphs into notifications.
- Tick Send alerts.
- Tick Alert when a service that starts automatically stops for two minutes to be told about stopped services.
- Enter the addresses under Send to, one per line, or leave it empty to use your profile's address.
- For each rule, set the threshold under Goes over and how many minutes it must stay there under For.
- Save, then Send a test alert to make sure mail arrives.
The rules are CPU usage, Memory usage, Disk space used, Messages waiting in the mail queue, IIS current connections, MariaDB connections and SQL Server connections. The duration matters: a CPU rule of 90% for 10 minutes ignores a backup's short burst but catches a stuck process. When a value returns to normal, a second email says so, so you know whether to keep looking. Recent alerts shows each alert and whether it was emailed.
Alerts go out the way outgoing mail is set up in Mail Server Settings, including a smarthost if you use one. Separate from monitoring alerts, Tools & Settings › Notifications sends account events such as Resource limit reached or SSL/TLS certificate renewal failed by email or to the panel's notice bell.
Services Management#
Tools & Settings › Services Management lists the Windows services StackRegent manages, grouped by area (the panel, IIS, FTP, DNS, MailEnable, antivirus and spam filtering, MariaDB and SQL Server), with state, startup type and process ID.
- Tick services and click Start, Stop or Restart, or use the icons on a row.
- Click the startup type to choose Automatic, Automatic (delayed start), Manual or Disabled.
- Tick Show services not installed yet to see the full list.
The panel's own services are deliberately not stoppable from the browser, so you cannot cut off the branch you are sitting on.
The Service Monitor tray app#
For the moments when the panel itself does not answer, StackRegent installs the StackRegent Service Monitor, a tray app for the server console or a Remote Desktop session. It starts when an administrator logs on, or from Start › StackRegent › StackRegent Service Monitor.
- Start, stop or restart services, including the panel's own services that the browser view protects.
- Start StackRegent website and Stop StackRegent website control the panel.
- Delete Sessions logs out everyone who is logged in to the panel.
- The tray menu has Open StackRegent panel in browser and Restart StackRegent panel.
The tray app is not installed on Server Core, which has no desktop; there, the stackregent command line covers recovery.
Task Manager and Process List#
Long jobs in StackRegent run as tasks: creating subscriptions, backups, restores, migrations, certificate orders, updates. Task Manager, from the icon in the top bar or Tools & Settings, filters by Running, Queued, Success or Failure and searches descriptions. Click a task to read its log as it is written. A failed task has Retry. If tasks stay Queued, the StackRegent Task Manager service is not running, and the Service Monitor can start it.
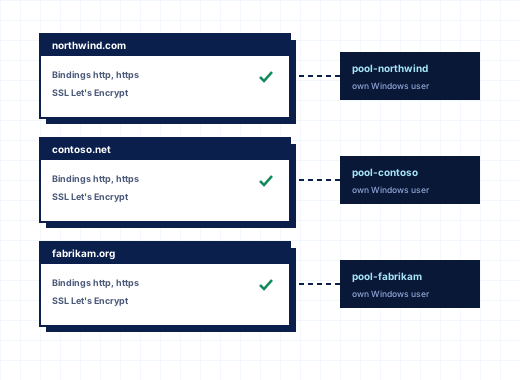
Tools & Settings › Process List shows every process on the server with PID, user, CPU, memory, threads and start time. Sort by any column, filter by name, user or PID, and End a process. It refreshes every 5 seconds. Because each subscription runs as its own Windows user, the user column tells you which customer a busy php-cgi.exe belongs to.
Disk and traffic statistics#
Server Management › Statistics has three tabs:
- Overview: server details, uptime, CPU load, memory and disks, domain and account counts, and this month's disk use and website traffic.
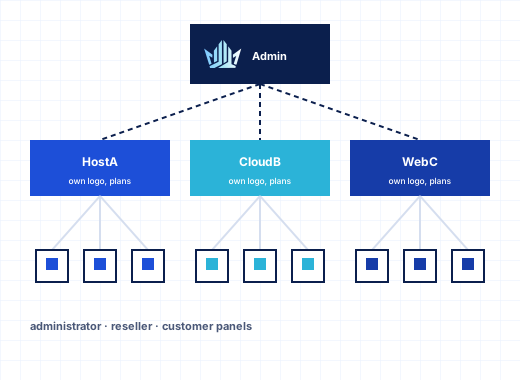
- Traffic: website traffic for a month By subscription, By website, By customer or By reseller, which is what you need for billing and for spotting a reseller whose customers took off.
- Settings: Keep statistics for a number of months, and which traffic counts toward the subscription limit: incoming and outgoing, outgoing only or incoming only.
Website traffic is counted from IIS every minute. Disk usage is measured every night; Recalculate measures now.
Customers see their own Statistics page with disk space split into websites, logs, mail, databases, backups and anonymous FTP, traffic per month, and resource graphs.
Web statistics for every website#
Each website has a Web Statistics page built from its IIS logs: totals for Visitors, Pages, Hits and Errors, a chart of Daily visits for the chosen month, Most visited pages, Referring sites, Browsers, Status codes, Pages not found (404) and Hits by hour. The numbers are read every night, so today appears tomorrow. Customers get visitor statistics without installing a tracking script, and the 404 list alone saves a lot of broken-link tickets.
Logs and failed request tracing#
For single requests, open a website and use:
- Logs: IIS access logs and the PHP error log. Choose the file and the number of lines, Filter, tick Follow to refresh every five seconds, or Download.
- Failed Request Tracing: switch on Trace failed requests for chosen status codes or slow requests, then download the traces. This is IIS's own tracing, without editing
applicationHost.config.
The Action Log under Tools & Settings records what administrators and the panel did, with time, user, address, object and details. Filter it by date and object or download it as CSV when an alert follows a change and you need to know who made it.
Advisor and Diagnose & Repair#
Advisor rates the server with a grade and a score out of 100, checking updates, SSL, PHP, backups, the firewall and the web application firewall. Items that need attention come first, with Fix for one-click fixes or Open to go to the right page.
Diagnose & Repair checks the installation, services, IIS, mail, DNS, databases and NTFS permissions in about a minute. Findings are marked OK, Warning or Problem; tick the repairable ones and click Repair Selected.
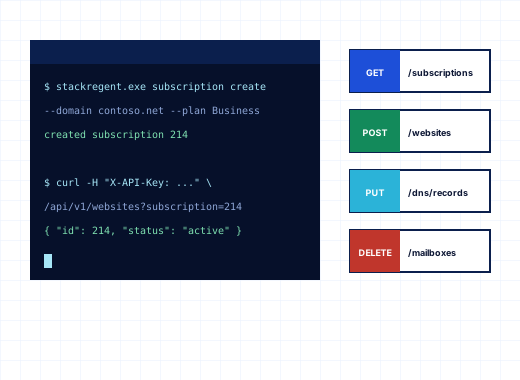
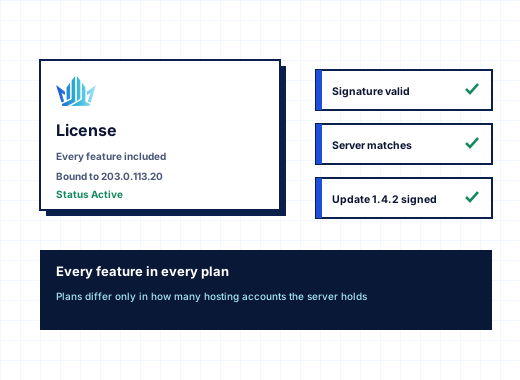
Want to act on events automatically? The Event Manager and REST API are covered under API and automation. Every StackRegent plan includes the full monitoring toolset; see pricing or the requirements.
Frequently asked questions
How do I monitor a Windows hosting server without extra software?
StackRegent records CPU, memory, disks, network, IIS, mail queue and database connections every minute and keeps graphs from one hour to one year, with email alerts, so no separate agent is needed for these figures.
Can I get an email when a Windows service stops?
Yes. On the Monitoring Alerts tab, tick Alert when a service that starts automatically stops for two minutes. A second email follows when the service is running again.
How do I find which website is using all the CPU on an IIS server?
Open Monitoring › Websites and choose a subscription to see its application pool's CPU and memory, or sort the Process List by CPU; the user column names the subscription because each runs as its own Windows user.
Does StackRegent include web statistics like AWStats?
StackRegent has built-in web statistics per website, read every night from the IIS logs: visitors, pages, hits, errors, daily visits, top pages, referrers, browsers, status codes, 404 pages and hits by hour.
What can I do if the panel does not open in the browser?
Log on to the server and use the StackRegent Service Monitor tray app to restart the panel services or the panel website. On Server Core, use the stackregent command line.
Can customers see their own traffic and resource usage?
Yes. Customers have Statistics and Resource Usage pages for their subscriptions, with disk space, monthly traffic, web statistics and CPU, memory, disk I/O and process graphs.